Use the **Live Queries** dashboard to monitor and display current running queries on your YugabyteDB universes. You can use this data to do the following:
- Visually identify relevant database operations.
- Evaluate query execution times.
- Discover potential queries for performance optimization.
All user roles — `Super Admin`, `Admin`, and `Read-only` — are granted permissions to use the **Live Queries** dashboard.
Note that there is no significant performance overhead on databases because the queries are fetched on-demand and are not tracked in the background.
The following table describes the **Live Queries** column values.
| Column | Description |
| ------------------------------ | ------------------------------------------------------------ |
| Node Name | The YB-TServer node name generated by YugabyteDB Anywhere. |
| Private IP | The IP address of the database node. |
| DB Name / Keyspace | The YCQL keyspace or YSQL database used by the query. |
| Session status
(YSQL only) | The YSQL session status: idle, active, idle in transaction, fastpath function call, idle in transaction (aborted), or disabled. |
| Query | The query command.
Example:
`select * from my_keyspace.my_table` |
| Query Start / Elapsed Time | The duration (in milliseconds) of the query handling. |
| Type
(YCQL only) | Shows the YCQL query type: PREPARE, EXECUTE, QUERY, or BATCH |
| Client Name
(YSQL only) | The client name used to execute the query. |
| Client Host | The address of the client that sent this query. |
| Client Port | The port of the client that sent this query. |
You can use the **Live Queries** dashboard as follows:
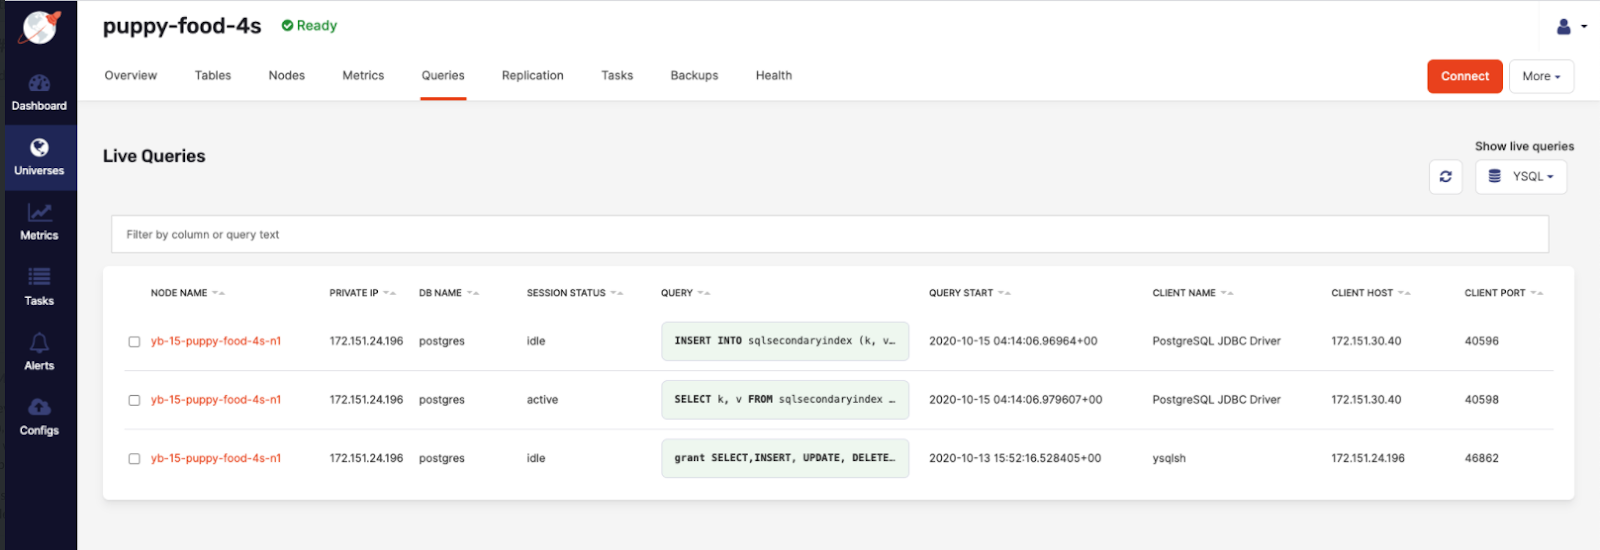
1. Navigate to the **Universes**, select your universe, then select **Queries**, and then select YSQL from **Show live queries** on the right, as per the following illustration:
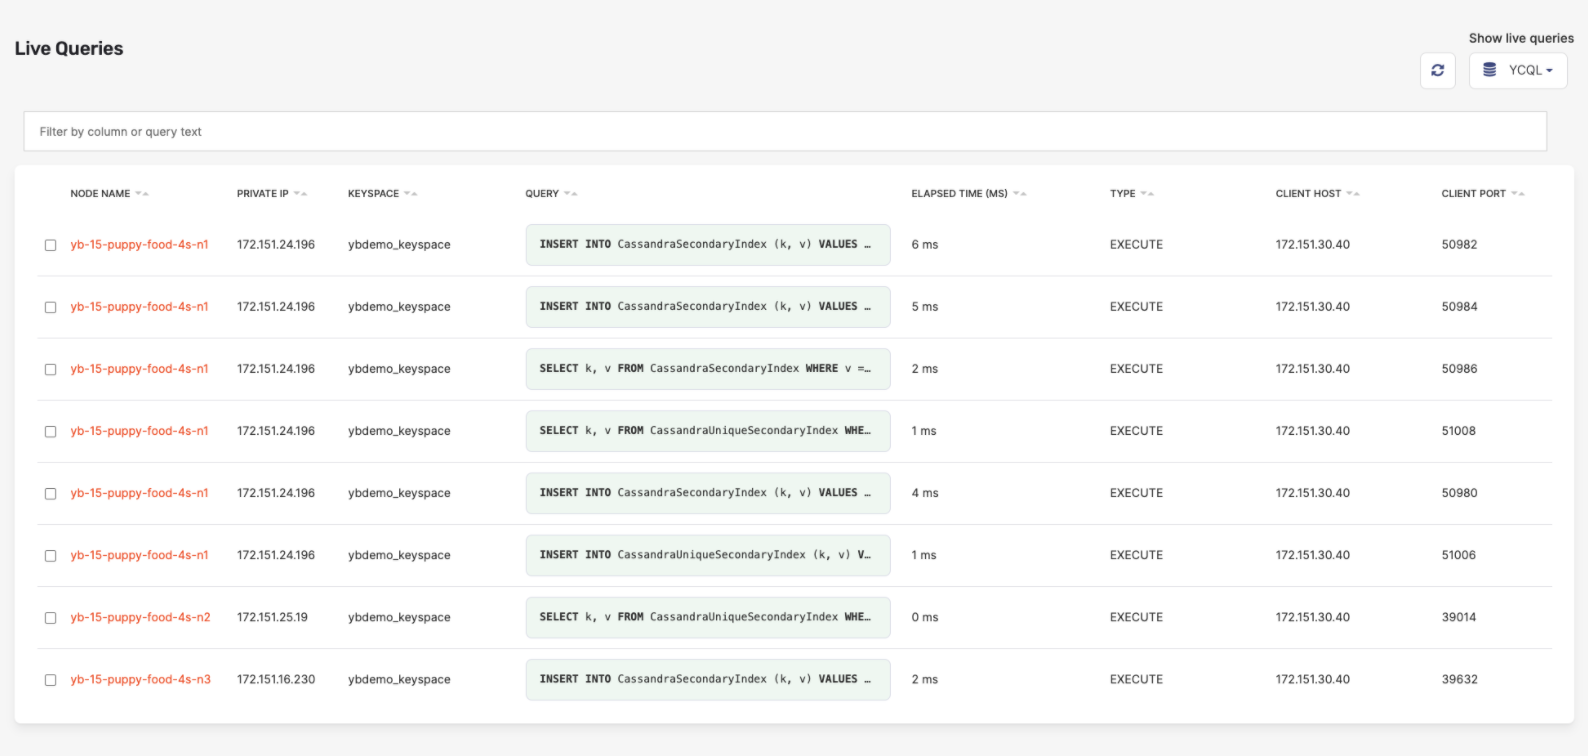
If you change the **Show live queries** selection to **YCQL**, the column headers change and the data is refreshed, as per the following illustration:
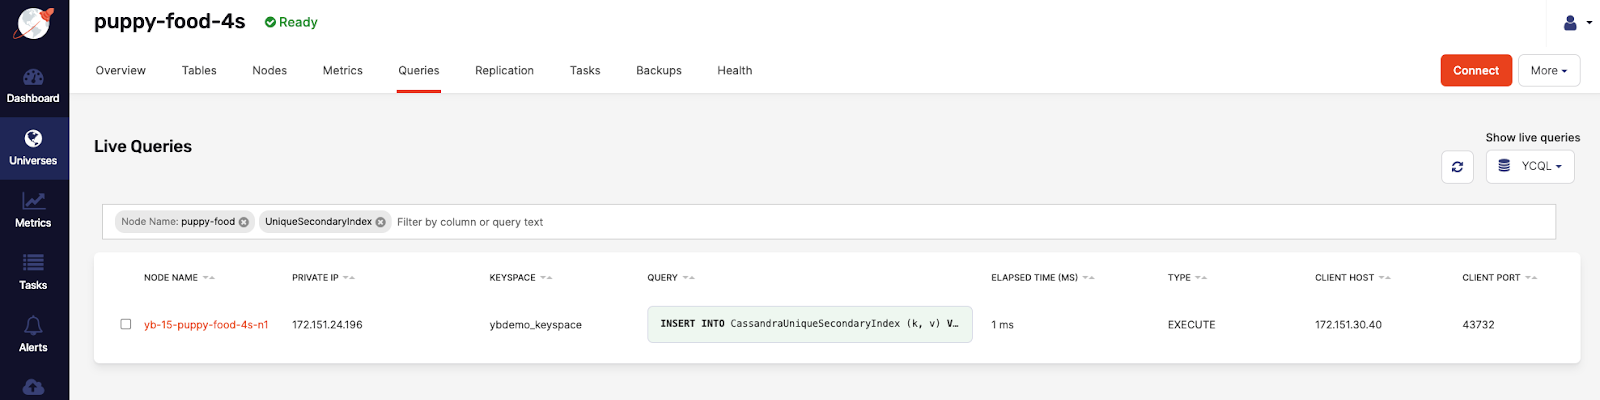
1. Click the search bar to trigger the display of the column filter options to be able to use a query language for filtering data based on certain fields, as per the following illustration:
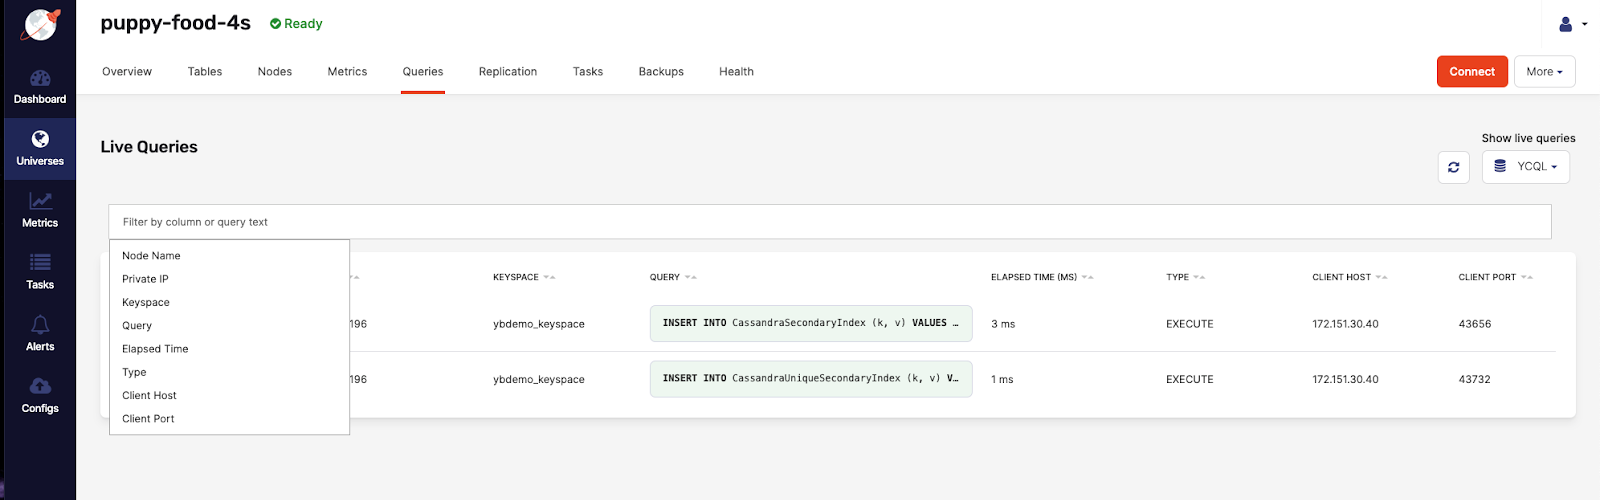
You can add multiple search terms that are applied as an intersection. In the following example, adding `Node Name` filters for all rows with a name containing `puppy-food` and have a `UniqueSecondaryIndex` in one of the data cells:
You can use filtering for comparisons on numbers columns (`Elapsed Time`) using `>`, `>=`, `<`, and `<=` to search for values that are greater than, greater than or equal to, less than, and less than or equal to another value (Elapsed Time: `< 50`). You can also use the range syntax `n..n` to search for values within a range, where the first number `n` is the lowest value and the second `n` is the highest value. The range syntax supports tokens like the following: `n..*` which is equivalent to `>= n`. Or `*..n` which is the same as `<= n`.
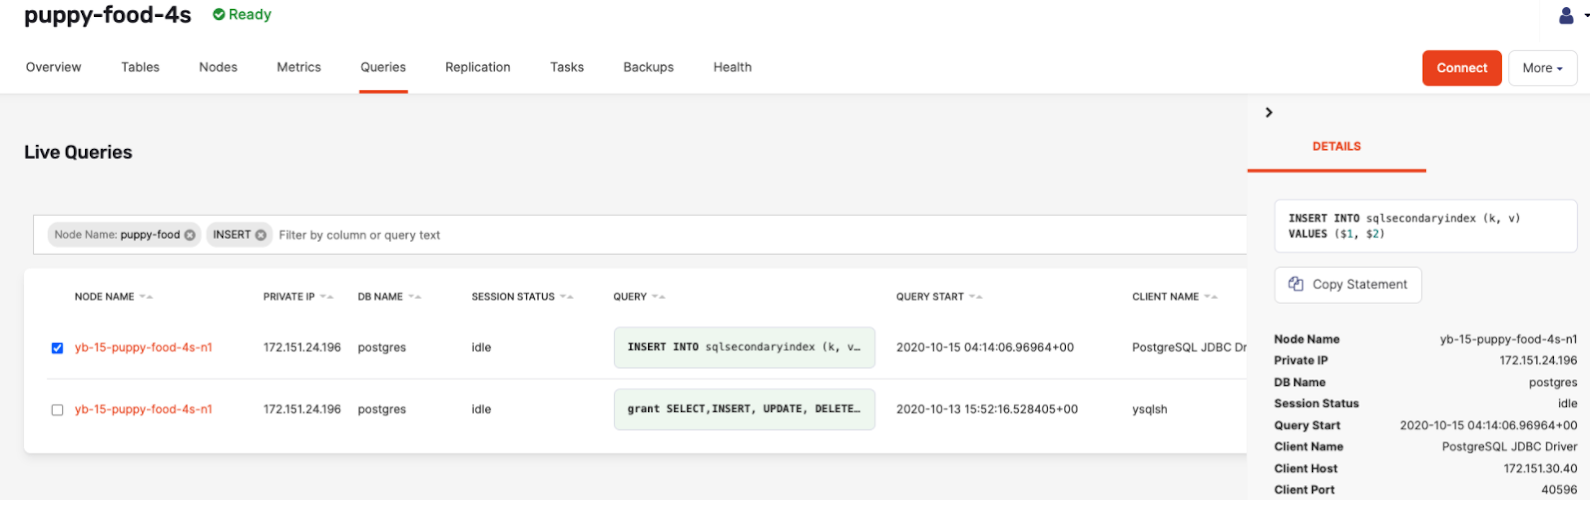
1. Click on a row to open a sidebar with a full view of the query statement, along with all the column data, as per the following illustration:
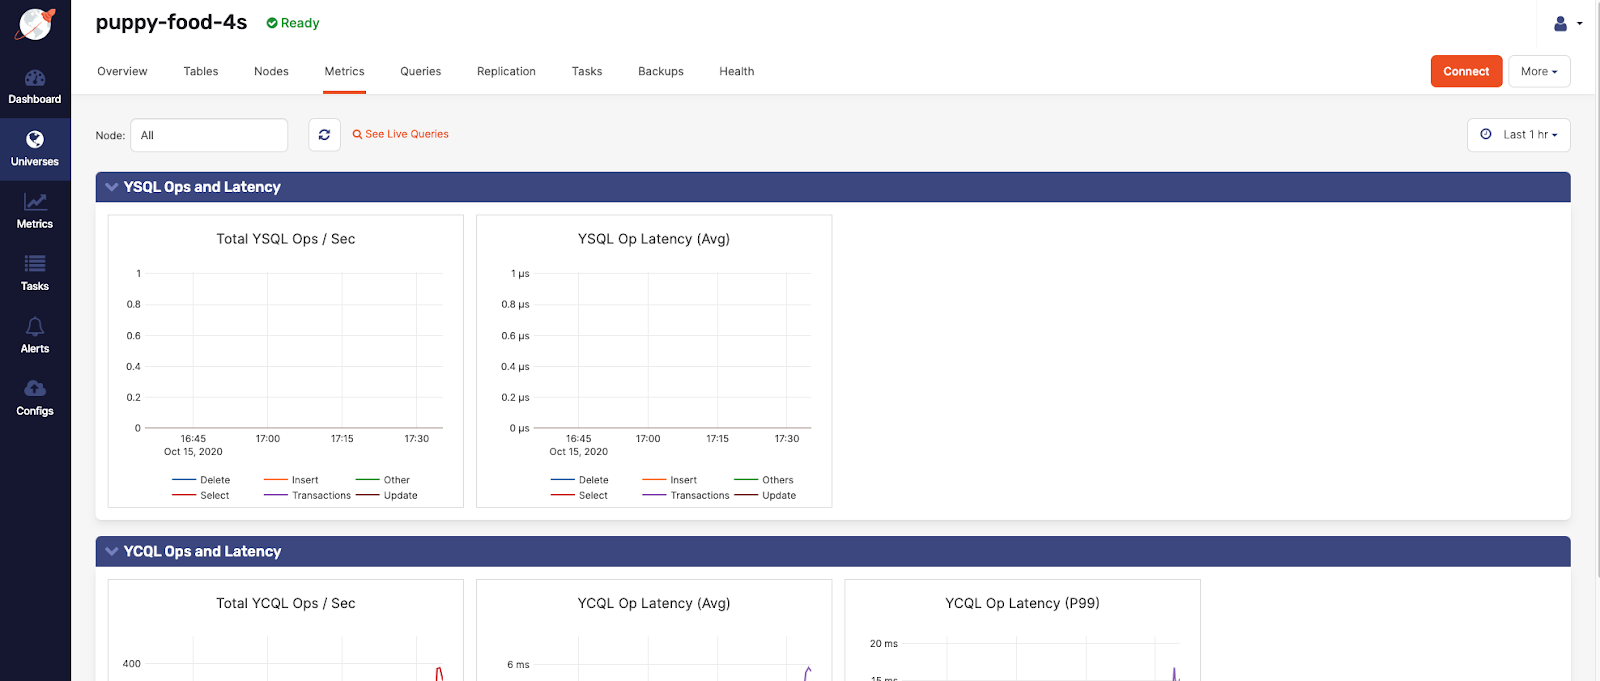
You can also find additional prefiltered navigation links from different pages to the **Live Queries** page. For example, from the **Metrics** page to the **Queries** page, when a node is selected from the list, as per the following illustration:
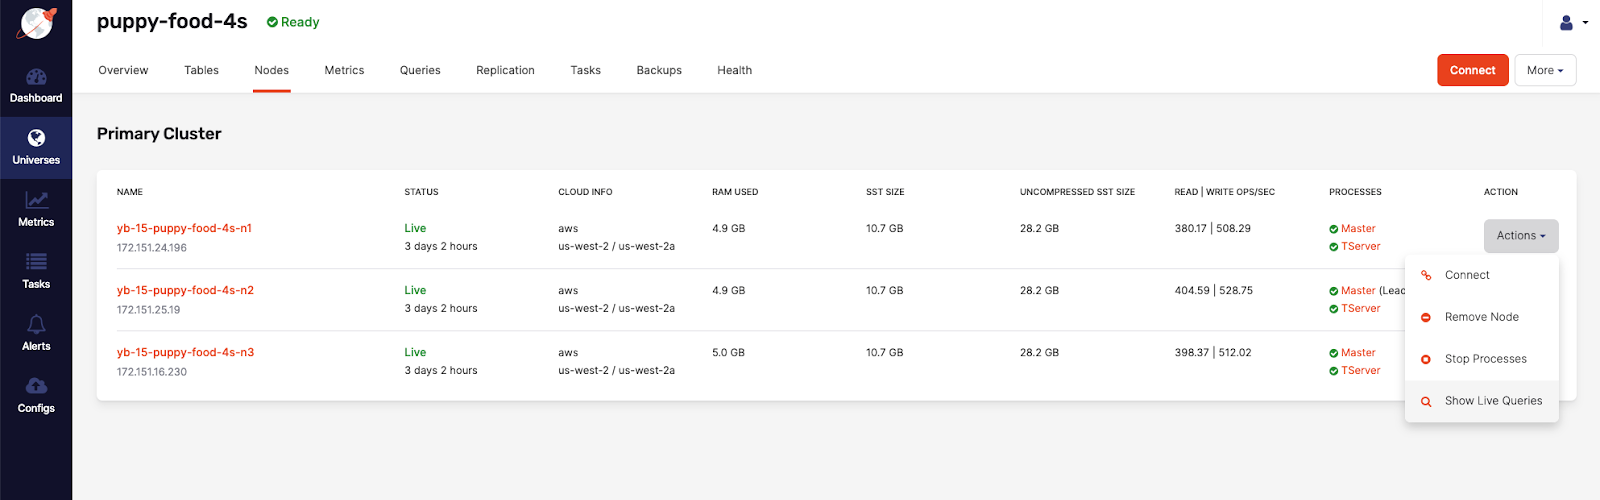
Or from the **Nodes** page to the **Live Queries** page, with the specific node prefiltered, as per the following illustration: