Monitor performance metrics for your cluster to ensure the cluster configuration matches its performance requirements using the cluster **Overview** and **Performance** tabs.
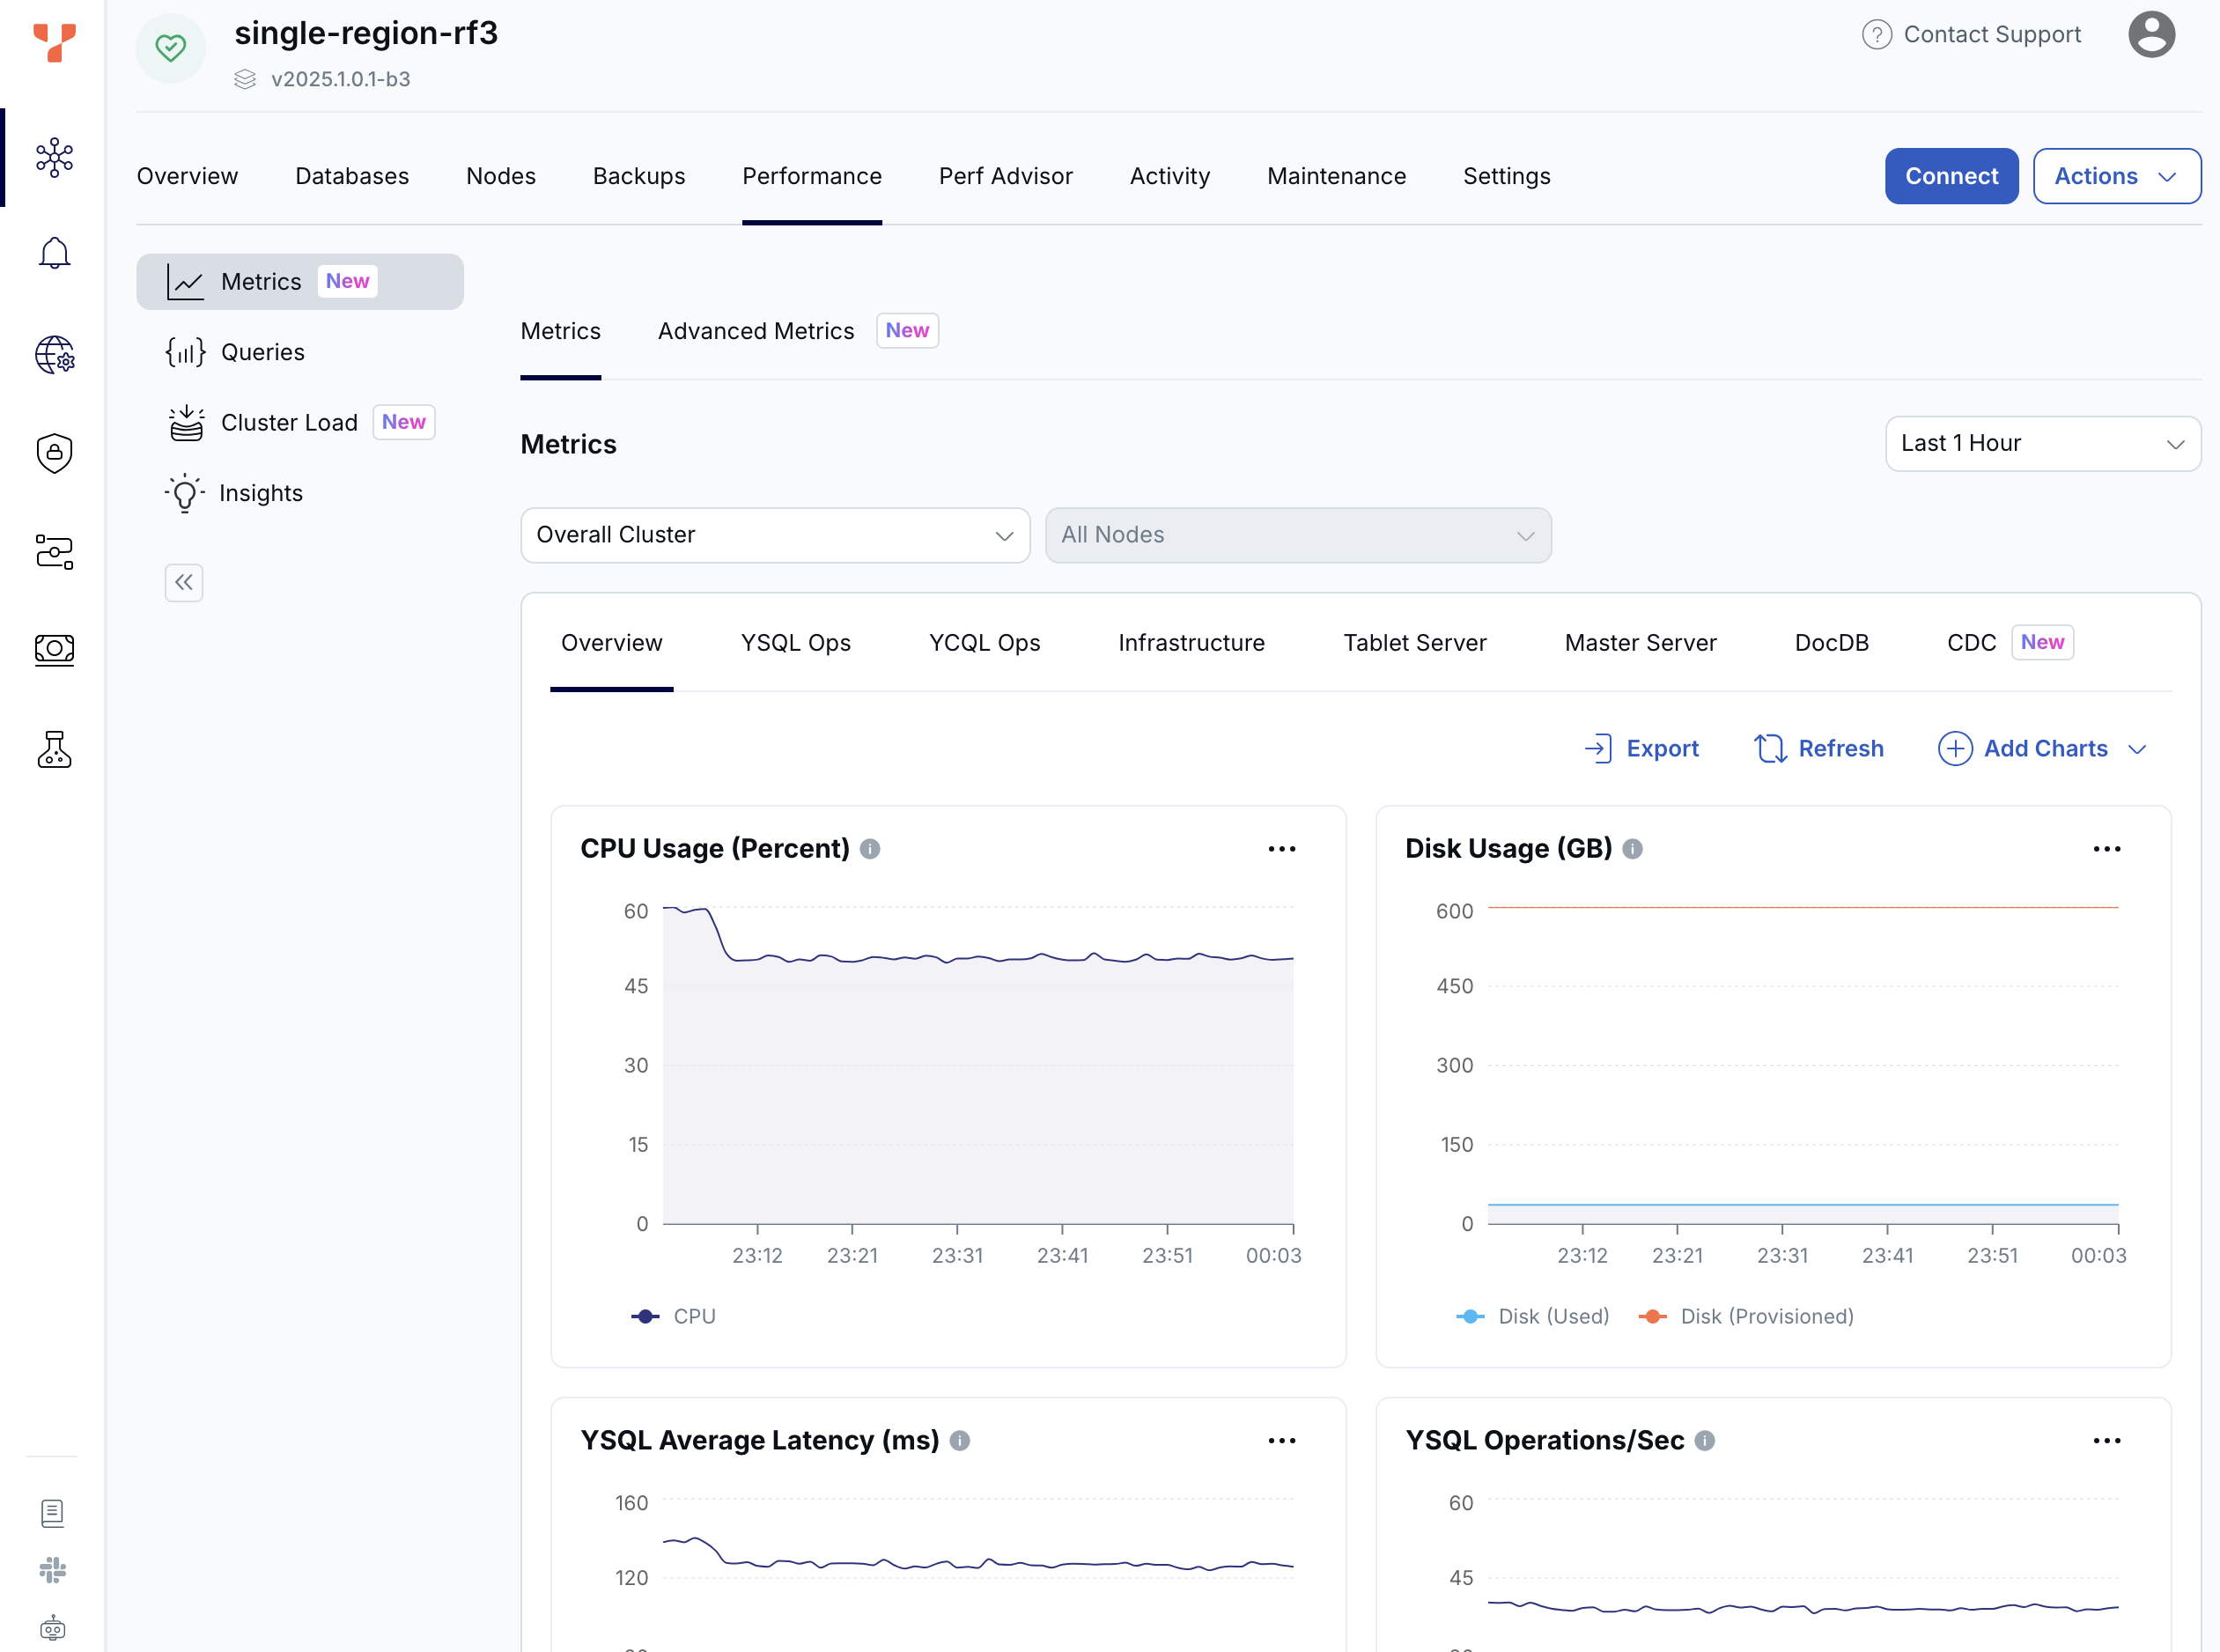
- The **Overview** tab displays a summary of the cluster infrastructure, along with time series charts of four key performance metrics for all the nodes in the cluster - Operations/sec, Average Latency, CPU Usage, and Disk Usage.
- The **Performance** tab **Metrics** displays a comprehensive array of more specific performance metrics, including for YSQL and YCQL API performance.
{{< youtube id="Xv4y6wWSHJ8" title="Monitor cluster performance in YugabyteDB Aeon" >}}
Use these metrics to monitor the performance of your cluster and to determine whether the configuration needs to change. For information on changing or scaling your cluster, refer to [Scale and configure clusters](../../cloud-clusters/configure-clusters/).
You can enable alerts for some performance metrics. Refer to [Alerts](../cloud-alerts/).
You can show metrics by region and by node, for the past hour, 6 hours, 12 hours, 24 hours, or 7 days.
## Overview metrics
The **Overview** tab shows metrics averaged over all the nodes in the cluster.
You can enable alerts for CPU usage and disk usage. Refer to [Alerts](../cloud-alerts/).
The following table describes the metrics available on the **Overview**.
| Graph | Description | Use |
| :---| :--- | :--- |
| Operations/sec | The number of [YB-TServer](../../../architecture/yb-tserver/) read and write operations per second. | Spikes in read operations are normal during backups and scheduled maintenance. If the count drops significantly below average, it might indicate an application connection failure. If the count is much higher than average, it could indicate a DDoS, security incident, and so on. Coordinate with your application team because there could be legitimate reasons for dips and spikes. |
| Average Latency (ms) | Read: the average latency of read operations at the tablet level.
Write: the average latency of write operations at the tablet level. | When latency starts to degrade, performance may be impacted by the storage layer. |
| CPU Usage (%) | The percentage of CPU use being consumed by the tablet or master server Yugabyte processes, as well as other processes, if any. In general, CPU usage is a measure of all processes running on the server. | High CPU use could indicate a problem and may require debugging by Yugabyte Support. An [alert](../cloud-alerts/) is issued when node CPU use exceeds 70% (Warning) or 90% (Severe) on average for at least 5 minutes. |
| Disk Usage (GB) | Shows the amount of disk space provisioned for and used by the cluster. | Typically you would scale up at 80%, but consider this metric in the context of your environment. For example, usage can be higher on larger disks. An [alert](../cloud-alerts/) is issued when the free storage on any node in the cluster falls below 40% (Warning) and 25% (Severe). |
## Performance metrics
To choose the metrics to display on the **Performance** tab, select **Metrics** and then click **Add Charts**. To rearrange the metrics, click **Add Charts** and **Reorder Charts**, then drag the chart to a new position. To [export metrics](../metrics-export/) to third-party tools, click **Export**. You can additionally view the metrics for specific nodes.
The **Performance** tab provides the following metrics in addition to the Overview metrics.
### YSQL Ops
| Graph | Description | Use |
| :---| :--- | :--- |
| YSQL Operations/Sec | The count of DELETE, INSERT, SELECT, and UPDATE statements through the YSQL API. This does not include index writes. | If the count drops significantly lower than your average count, it might indicate an application connection failure. In addition, if the count is much higher than your average count, it could indicate a DDoS, security incident, and so on. You should coordinate with your application team because there could be legitimate reasons for dips and spikes. |
| YSQL Average Latency (ms) | Average time (in milliseconds) of DELETE, INSERT, SELECT, and UPDATE statements through the YSQL API. | When latency is close to or higher than your application SLA, it may be a cause for concern. The overall latency metric is less helpful for troubleshooting specific queries. It is recommended that the application track query latency. There could be reasons your traffic experiences spikes in latency, such as when ad-hoc queries such as count(*) are executed. |
| YSQL Connections | Cumulative number of connections to YSQL backend for all nodes. This includes various background connections, such as checkpointer, as opposed to an active connections count that only includes the client backend connections. Only visible if Connection Pooling is off. | By default, you can have up to 15 simultaneous connections per vCPU. An [alert](../cloud-alerts/) is issued when the number of connections exceeds 60% (Warning) and 85% (Severe) of the limit. |
| Client Connections | (Connection Pooling only.) Cumulative number of connections to Connection pooler for all nodes. | By default, you can have up to 150 simultaneous client connections per vCPU. |
| Client Connection Average Wait Time (ns) | (Connection Pooling only.) Average time (in nanoseconds) for clients to establish a database server connection, including the wait time in client queue. | If the time is lower, lower latency will be observed for queries. If higher, your application will experience higher latencies; you should coordinate with your application team as there can be legitimate reasons, such as connections taking longer to exit, or the application needs more server connections. |
| Server Connections | (Connection Pooling only.) Cumulative number of connections in use by Connection Pooler to YSQL backend for all nodes. | By default, you can have up to 15 simultaneous connections per vCPU. An alert is issued when the number of connections exceeds 60% (Warning) and 85% (Severe) of the limit. |
| Database transactions/Sec | (Connection Pooling only.) Cumulative number of database transactions performed per second across all nodes. | If the count drops significantly lower than your average count, it might indicate an application connection failure. In addition, if the count is much higher than your average count, it could indicate a DDoS, security incident, and so on. You should coordinate with your application team, because there can be legitimate reasons for dips and spikes. |
### YCQL Ops
| Graph | Description | Use |
| :---| :--- | :--- |
| YCQL Operations/Sec | The count of DELETE, INSERT, SELECT, and UPDATE transactions, as well as other statements through the YCQL API. | If the count drops significantly lower than your average count, this could indicate an application connection failure. |
| YCQL Average Latency (ms) | The average time (in milliseconds) of DELETE, INSERT, SELECT, and UPDATE transactions, as well as other statements through the YCQL API. | When latency is close to or higher than your application SLA, it may be a cause for concern. |
### Infrastructure
| Graph | Description | Use |
| :---| :--- | :--- |
| CPU Usage (%) | The percentage of CPU use being consumed by the tablet or master server Yugabyte processes, as well as other processes, if any. In general, CPU usage is a measure of all processes running on the server. | High CPU use could indicate a problem and may require debugging by Yugabyte Support. An [alert](../cloud-alerts/) is issued when node CPU use exceeds 70% (Warning) or 90% (Severe) on average for at least 5 minutes. |
| Disk Usage (GB) | Shows the amount of disk space provisioned for and used by the cluster. | Typically you would scale up at 80%, but consider this metric in the context of your environment. For example, usage can be higher on larger disks. An [alert](../cloud-alerts/) is issued when the free storage on any node in the cluster falls below 40% (Warning) and 25% (Severe). |
| Memory Usage (GB) | Shows the amount of RAM (in GB) used and available to the cluster. | An [alert](../cloud-alerts/) is issued if memory use exceeds 70 (Warning) or 90 (Severe) per cent. Typically you would add vCPUs if load regularly exceeds 90 per cent. |
| Network Bytes/Sec (MiB) | The size (in mebibytes) of network packets received (RX) and transmitted (TX) per second, averaged over nodes. | Shows the amount of network traffic to and from the server. |
| Disk Bytes/Sec (MiB) | The number of mebibytes being read or written to disk per second, averaged over each node. | If the maximum IOPS for the instance volume type has high utilization, you should ensure that the schema and query are optimized. In addition, consider increasing the instance volume IOPS capacity. |
| Disk IOPS/Sec | The number of disk input / output read and write operations provisioned and used, per second averaged over each node. | Large spikes usually indicate large compactions. Rarely, in cases of a spiky workload, this could indicate block cache misses.
Because random reads always hit disk, you should increase IOPS capacity for this type of workload.
This value is averaged across all nodes in a cluster. |
| Network Errors/Sec | The number of errors related to network packets received (RX) and transmitted (TX) per second, averaged over nodes. | If your environment produces a lot of errors, that could indicate an underlying infrastructure or operating system issue. |
| Network Packets/Sec | The count of network packets received to the server (RX) and transmitted from the server (TX) per second, averaged over nodes. | Shows the amount of network traffic to and from the server. |
| Clock Skew (ms) | The clock drift and skew across different nodes. | Important for performance and data consistency. An OSS product can refuse to come up or can crash at a default value of 500 milliseconds, as it is considered better to be down than inconsistent.
It should be considered a top priority to resolve clock skew. |
| RPC Queue Size | The number of remote procedure calls (RPC) in service queues for tablet servers, including the following services: CDC (Change Data Capture); Remote Bootstrap; TS RPC (Tablet Server Service); Consensus; Admin; Generic; Backup. | The queue size is an indicator of the incoming traffic. If the backends get overloaded, requests pile up in the queues. When the queue is full, the system responds with backpressure errors. |
### Tablet Server
The [YugabyteDB Tablet Server](../../../architecture/yb-tserver/) (YB-TServer) is responsible for the actual I/O of client requests in a YugabyteDB cluster. Each node in the cluster has a YB-TServer, and each one hosts one or more tablet peers.
| Graph | Description | Use |
| :---| :--- | :--- |
| YB-TServer Operations/sec | The number of YB-TServer read and write operations per second. | Spikes in read operations are normal during backups and scheduled maintenance. If the count drops significantly below average, it might indicate an application connection failure. If the count is much higher than average, it could indicate a DDoS, security incident, and so on. Coordinate with your application team because there could be legitimate reasons for dips and spikes. |
| YB-TServer Average Latency (ms) | Read: the average latency of read operations at the tablet level.
Write: the average latency of write operations at the tablet level. | When latency starts to degrade, performance may be impacted by the storage layer. |
| Handler Latency (ms) | Incoming queue: time (in milliseconds) incoming RPC requests spend in the worker queue before the beginning of processing.
Outbound queue time: time (in milliseconds) between an outbound call being created and put in the queue.
Outbound transfer time: time (in milliseconds) the outgoing traffic takes to exit the queue.
Note that Handler is a software implementation of a ring queue. | If this metric spikes or remains at a high level, it indicates a network issue or that the queues are full. |
| YB-TServer Threads Running | The current number of running threads. | You may consider this information while examining other metrics. |
| YB-TServer Threads Started | The total number of threads started on this server. | You may consider this information while examining other metrics. |
| YB-TServer Consensus RPCs/Sec | Yugabyte implements the Raft consensus protocol, with minor modifications.
Update: replicas implement an RPC method called UpdateConsensus which allows a leader to replicate a batch of log entries to the follower. Only a leader may call this RPC method, and a follower can only accept an UpdateConsensus call with a term equal to or higher than its currentTerm.
Request: replicas also implement an RPC method called RequestConsensusVote, which is invoked by candidates to gather votes.
MultiRaftUpdates: information pending. | A high number for the Request Consensus indicates that a lot of replicas are looking for a new election because they have not received a heartbeat from the leader.
A high CPU or a network partition can cause this condition. |
| YB-TServer TCMalloc Stats (MiB) | In Use (Heap Memory Usage): memory (in mebibytes) used by the application. Typically, this does not match the memory use reported by the OS because it does not include TCMalloc overhead or memory fragmentation.
Total (Reserved Heap Memory): system memory (in mebibytes) reserved by TCMalloc. | Also consider the following:
Free Heap Memory: the number of bytes in free, mapped pages in a page heap. These bytes can be used to fulfill allocation requests. They always count towards virtual memory usage, and unless the underlying memory is swapped out by the OS, they also count towards physical memory usage.
Unmapped Heap Memory: the number of bytes in free, unmapped pages in a page heap. These are bytes that have been released back to the OS, possibly by one of the MallocExtension Release calls. They can be used to fulfill allocation requests, but typically incur a page fault. They always count towards virtual memory usage, and depending on the OS, usually do not count towards physical memory usage.
Thread Cache Memory Limit: a limit to the amount of memory that TCMalloc dedicates for small objects. In some cases, larger numbers trade off more memory use for improved efficiency.
Thread Cache Memory Usage: a measure of some of the memory TCMalloc is using (for small objects). |
| YB-TServer Glog Messages | The following log levels are available:
Info: the number of INFO-level log messages emitted by the application.
Warning: the number of WARNING-level log messages emitted by the application.
Error: the number of ERROR-level log messages emitted by the application. | Use a log aggregation tool for log analysis. You should review the ERROR-level log entries regularly. |
| YB-TServer Change Config Latency (ms) | Latency of consensus change configuration processes. | You may consider this information while examining other metrics. |
| YB-TServer Change Config RPCs | This metric is related to the Raft consensus process. The number of times a peer was added or removed from the consensus group. | An increase in Change Config typically happens when YugabyteDB needs to move data around. This may happen as a result of a planned server addition or decommission, or a server crash looping. |
| YB-TServer Context Switches | Voluntary context switches are writer processes that take a lock.
Involuntary context switches happen when a writer process has waited longer than a set threshold, which results in other waiting processes taking over. | A large number of involuntary context switches indicates a CPU-bound workload. |
| YB-TServer Leader Elections Lost RPCs | This metric is related to the Raft consensus process. The number of times a leader election has failed. | Leader election failures could be an indicator of a high CPU, blocked RPC queues, server restarts, and so on. |
| YB-TServer Leader Step Down RPCs | This metric is related to the Raft consensus process. The number of leader changes. | A Leader Step Down can indicate a normal change in leader, or it could be an indicator of a high CPU, blocked RPC queues, server restarts, and so on. |
| YB-TServer WAL Latency (ms) | Group (Log Group Commit Latency): time (in milliseconds) spent on committing an entire group.
Append (Log Append Latency): time (in milliseconds) spent on appending to the log segment file.
Sync (Log Sync Latency): time (in milliseconds) spent on synchronizing the log segment file. | These metrics provide information on the amount to time spent writing to a disk. You should perform tuning accordingly. |
| YB-TServer WAL Operations/Sec | Group (Log Group Commit Count): the number of commits of an entire group, per second, per node.
Append (Log Append Count): the number of appends to the log segment file, per second, per node.
Sync (Log Sync Count): the number of syncs for the log segment file, per second, per node. | |
| YB-TServer Consensus RPC Latency (ms) | Request Consensus Vote: latency of consensus request operations.
Update Consensus: latency of consensus update operations.
Multi-Raft Update Consensus: information pending. | If the value is high, it is likely that the overall latency is high.
This metric should be treated as a starting point in debugging the YB-Master and YB-TServer processes. |
| YB-TServer Remote Bootstrap RPCs | The total count of remote bootstraps. | When a Raft peer fails, YugabyteDB executes an automatic remote bootstrap to create a new peer from the remaining ones.
Bootstrapping can also be a result of planned user activity when adding or decommissioning nodes. |
| YB-TServer Remote Bootstrap Connections | The total count of remote bootstrap connections. | When a Raft peer fails, YugabyteDB executes an automatic remote bootstrap to create a new peer from the remaining ones.
Bootstrapping can also be a result of planned user activity when adding or decommissioning nodes. |
| YB-TServer Leader Election RPCs | This metric is related to the Raft consensus process. The number of times a leader has been elected. | |
| YB-TServer Spinlock Contention Time (s) | Spinlock is a measurement of processes waiting for a server resource and using a CPU to check and wait repeatedly until the resource is available. | This value can become very high on large computers with many cores.
The flag `tserver_tcmalloc_max_total_thread_cache_bytes` is by default 256 MB, and this is typically sufficient for 16-core computers with less than 32 GB of memory. For larger computers, it is recommended to increase this to 1 GB or 2 GB.
You should monitor memory usage, as this requires more memory. |
| YB-TServer CPU Usage (%) | The percentage of CPU use being consumed by the tablet server Yugabyte processes, as well as other processes, if any. In general, CPU usage is a measure of all processes running on the server. | High CPU use could indicate a problem and may require debugging by Yugabyte Support. |
| YB-TServer WAL Bytes (MiB/Sec) | The number of mebibytes read from and written to the WAL after the tablet start. | A low-level metric related to the storage layer. This can help debug certain latency or throughput issues by isolating where the bottleneck happens. An increase in reads indicates that followers are falling behind and are constantly trying to catch up.
In an xCluster replication topology, this can indicate replication latency. |
| YB-TServer Local vs. Remote operations | The number of local and remote read and write requests. Remote requests are rerouted internally to a different node for executing the operation. | If an application is using a driver that supports local query routing optimization and prepared statements, the expected value for this is close to zero. If using a YCQL driver or not using prepared statements, expect to see a relatively even split between local and remote operations (for example, ~66% of requests to be remote for a 3-node cluster). |
### Master Server
The [YugabyteDB Master Server](../../../architecture/yb-master/) (YB-Master) hosts system metadata, records about tables in the system and locations of their tablets, users, roles, permissions, and so on. YB-Masters are also responsible for coordinating background operations.
| Graph | Description | Use |
| :---| :--- | :--- |
| Get Tablet Location RPCs/sec | The number of times the locations of the replicas for a given tablet were fetched from the master servers, per second. | |
| YB-Master Consensus Latency (ms) | Latency of consensus update operations and of multiple Raft group consensus update operations. | |
| YB-Master Heartbeats/sec | The count of heartbeats received by the master server leader from the tablet servers. This establishes liveness and reports back any status changes. | This measure can be used to determine which master is the leader, as only the leader gets active heartbeats. |
| YB-Master Latency (ms) | The average latency of YSQL reads and writes of the PostgreSQL system tables (during DDL). | |
| YB-Master Operations/sec | YSQL reads and writes of the PostgreSQL system tables (during DDL). | |
| YB-Master Consensus RPCs/sec | The number of consensus update operations and of multiple Raft group consensus update operations. | |
| YB-Master RPCs Created/Sec | The number of created RPC inbound calls to the master servers per second. | |
| YB-Master RPC Connections | The number of created RPC inbound calls to the master servers. | The limit is 1000 TPS on the master, but under normal circumstances this number should be much lower than the limit. |
| YB-Master CPU Usage (%) | The percentage of CPU use being consumed by the master server Yugabyte process. | The master server should not use a full CPU. |
| Create / Delete Table RPCs | The count of administrative operations CreateTable and DeleteTable. | A deletion can fail when other operations, such as bootstrap, are running. This uses a configured retry timeout. |
| YB-Master Glog Messages | The following log levels are available:
Info: the number of INFO-level log messages emitted by the application.
Warning: the number of WARNING-level log messages emitted by the application.
Error: the number of ERROR-level log messages emitted by the application. | It is recommended to use a log aggregation tool for log analysis. You should review the ERROR-level log entries on a regular basis. |
| YB-Master Average Latency (ms) | The average latency of various RPC services, provided by Master server | |
| YB-Master WAL Latency (ms) | This is related to WALs.
Commit (Log Group Commit Latency): time (in milliseconds) spent on committing an entire group.
Append (Log Append Latency): time (in milliseconds) spent on appending to the log segment file.
Sync (Log Sync Latency): time (in milliseconds) spent on synchronizing the log segment file. | You may consider this information while examining other metrics. |
| YB-Master Threads Running | The current number of running threads. | You may consider this information while examining other metrics. |
| YB-Master TCMalloc Stats (MiB) | Used (Heap Memory Usage): memory (in mebibytes) used by the application. Typically, this does not match the memory use reported by the OS because it does not include TCMalloc overhead or memory fragmentation.
Provisioned (Reserved Heap Memory): system memory (in mebibytes) reserved by TCMalloc. | You may consider this information while examining other metrics. |
| YB-Master WAL Bytes (MiB/Sec) | The number of mebibytes read from and written to the WAL per second, after the tablet start. | You may consider this information while examining other metrics. |
### DocDB
[DocDB](../../../architecture/docdb) is a distributed document store that serves as the YugabyteDB storage layer. It uses a highly customized version of [RocksDB](http://rocksdb.org/), a log-structured merge tree-based key-value store.
| Graph | Description | Use |
| :---| :--- | :--- |
| YB-Master RocksDB Operations/sec | The number of master RocksDB operations per second. | You may consider this information while examining other metrics. |
| YB-Master RocksDB SST Disk Usage (GB) | The size (in gigabytes) of all SST files. | |
| YB-Master RocksDB SST Files | The number of SST files. | |
| YB-Master RocksDB Cache | Hit: the total number of block cache hits (cache index + cache filter + cache data).
Miss: the total number of block cache misses (cache index + cache filter + cache data). | |
| YB-Master RocksDB Cache Usage (GB) | A block requires multiple touches before it is added to the multi-touch (hot) portion of the cache.
Multi Touch: the size (in gigabytes) of the cache usage by blocks having multiple touches.
Single Touch: the size (in gigabytes) of the cache usage by blocks having only a single touch. | |
| YB-Master RocksDB Blooms | Checked: the number of times the bloom filter has been checked.
Useful: the number of times the bloom filter has avoided file reads (avoiding IOPS). | Bloom filters are hash tables used to determine if a given SSTable has the data for a query looking for a particular value.
Bloom filters are not helpful for range queries. |
| YB-Master RocksDB Flush Write Bytes (MiB) | The number of mebibytes written during the flush process. | |
| YB-Master RocksDB Compaction (MiB) | The number of mebibytes being read and written to do compaction. | If not a lot of data is being deleted, these levels are similar. In some cases, you might see a large delete indicated by large reads but low writes afterwards (because a large percentage of data was removed in compaction). |
| YB-Master RocksDB Compaction Files | The average number of files in any single compaction. | |
| YB-Master RocksDB Compaction Time (ms) | Time for the compaction processes to complete. | |
| YB-TServer Compaction (MiB) | The number of mebibytes being read and written to do compaction. | If not a lot of data is being deleted, these levels are similar. In some cases, you might see a large delete indicated by large reads but low writes afterwards (because a large percentage of data was removed in compaction). |
| YB-TServer Average SST Files/Node | The average number of SSTable (SST) files across nodes. | A low-level metric related to the storage layer. This can help debug certain latency or throughput issues by isolating where the bottleneck happens. |
| YB-TServer RocksDB Operations/sec | The number of master RocksDB operations per second. | You may consider this information while examining other metrics. |
| YB-TServer RocksDB SST Disk Usage (GB) | The size (in gigabytes) of all SST files. | |
| YB-TServer RocksDB Latency (ms) | Get: Latency (in milliseconds) to retrieve data matching a value.
Write: Latency (in milliseconds) to write data.
Seek: Latency (in milliseconds) to retrieve data in a range query.
Mutex Wait: The wait time for the DB mutex. This mutex is held for meta operations, such as checking data structures before and after compactions or flushes. | |
| YB-TServer RocksDB Cache | Hit: the total number of block cache hits (cache index + cache filter + cache data).
Miss: the total number of block cache misses (cache index + cache filter + cache data). | |
| YB-TServer RocksDB Cache Usage (GB) | A block requires multiple touches before it is added to the multi-touch (hot) portion of the cache.
Multi Touch: the size (in gigabytes) of the cache usage by blocks having multiple touches.
Single Touch: the size (in gigabytes) of the cache usage by blocks having only a single touch. | |
| YB-TServer RocksDB Blooms | Checked: the number of times the bloom filter has been checked.
Useful: the number of times the bloom filter has avoided file reads (avoiding IOPS). | Bloom filters are hash tables used to determine if a given SSTable has the data for a query looking for a particular value.
Bloom filters are not helpful for range queries. |
| YB-TServer RocksDB Stall Time (ms) | Time the writer has to wait for compactions or flushes to finish. | |
| YB-TServer RocksDB Write Rejections | The number of RPC requests rejected due to the number of majority SST files. | Rejections can happen due to hitting the soft limit on SST files. |
| YB-TServer RocksDB Memory Pressure Rejections | The number of RPC requests rejected due to the number of majority SST files. | Rejections can happen due to hitting the soft memory limit (set to 85% of the hard limit), and so on. |
| YB-TServer RocksDB Flush Write Bytes (MiB) | The number of mebibytes written during the flush process. | |
| YB-TServer RocksDB Compaction Files | The average number of files in any single compaction. | |
| YB-TServer RocksDB Compaction Time (ms) | Time for the compaction processes to complete. | |
| YB-TServer RocksDB Transactions | Expired: the number of expired distributed transactions.
Conflicts: the number of conflicts detected among uncommitted distributed transactions.
Related to the process that resolves conflicts for write transactions. This process reads all intents that could conflict and tries to abort transactions with a lower priority. If a write transaction conflicts with a higher-priority transaction, then an error is returned and this metric is iterated. | |
| YB-TServer RocksDB Transaction Pool Cache | Percentage of transaction pool requests fulfilled by the transaction pool cache. | |
| YB-TServer RocksDB Tablet Splitting Operations | Tracks tablet splits that have passed each of the following states:
Add: Successfully submitted split RPC requests (applied on leader only)
Apply: Successfully applied Raft split operations.
Post Split Compactions: Number of successfully started post-split compactions. | If these metrics are high, a lot of tablet splits are being performed. These numbers should be roughly equal, and any large gap between them is anomalous. |
| YB-TServer RocksDB Tablet Splitting Manager Runtime (ms) | The duration of the last automatic split manager run. | The automatic split manager runs periodically to determine whether or not any new tablets are eligible for splitting. |